Spending vs. Plan
(Statement of Comparison of Budget & Actual Amounts)
Understanding how government spending compares to the planned budget
What is it?
This statement shows whether the government kept its promises and used money wisely.
It compares what was planned (the budget) with what actually happened. By reading this statement, you can see if the government delivered on what it said it would do, and whether public money was spent as intended. It helps you hold the government accountable for both planning and delivery.
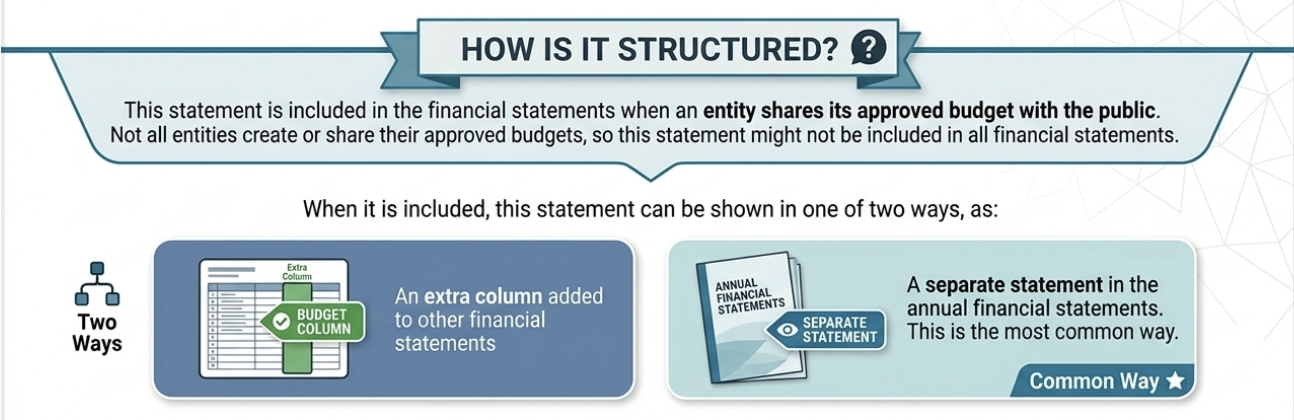
This statement is included in the financial statements when an entity shares its approved budget with the public. Not all entities create or share their approved budgets, so this statement might not be included in all financial statements.
What does this statement show?
This statement shows how much money the government planned to spend (the budget) against to how much it really spent (the actual results). It helps you see whether they stuck to their budget or if there were big changes to that plan.
Think of it like comparing your monthly household budget to your bank statement at the end of the month. Did you spend your money the way you had planned? Or were there surprises?
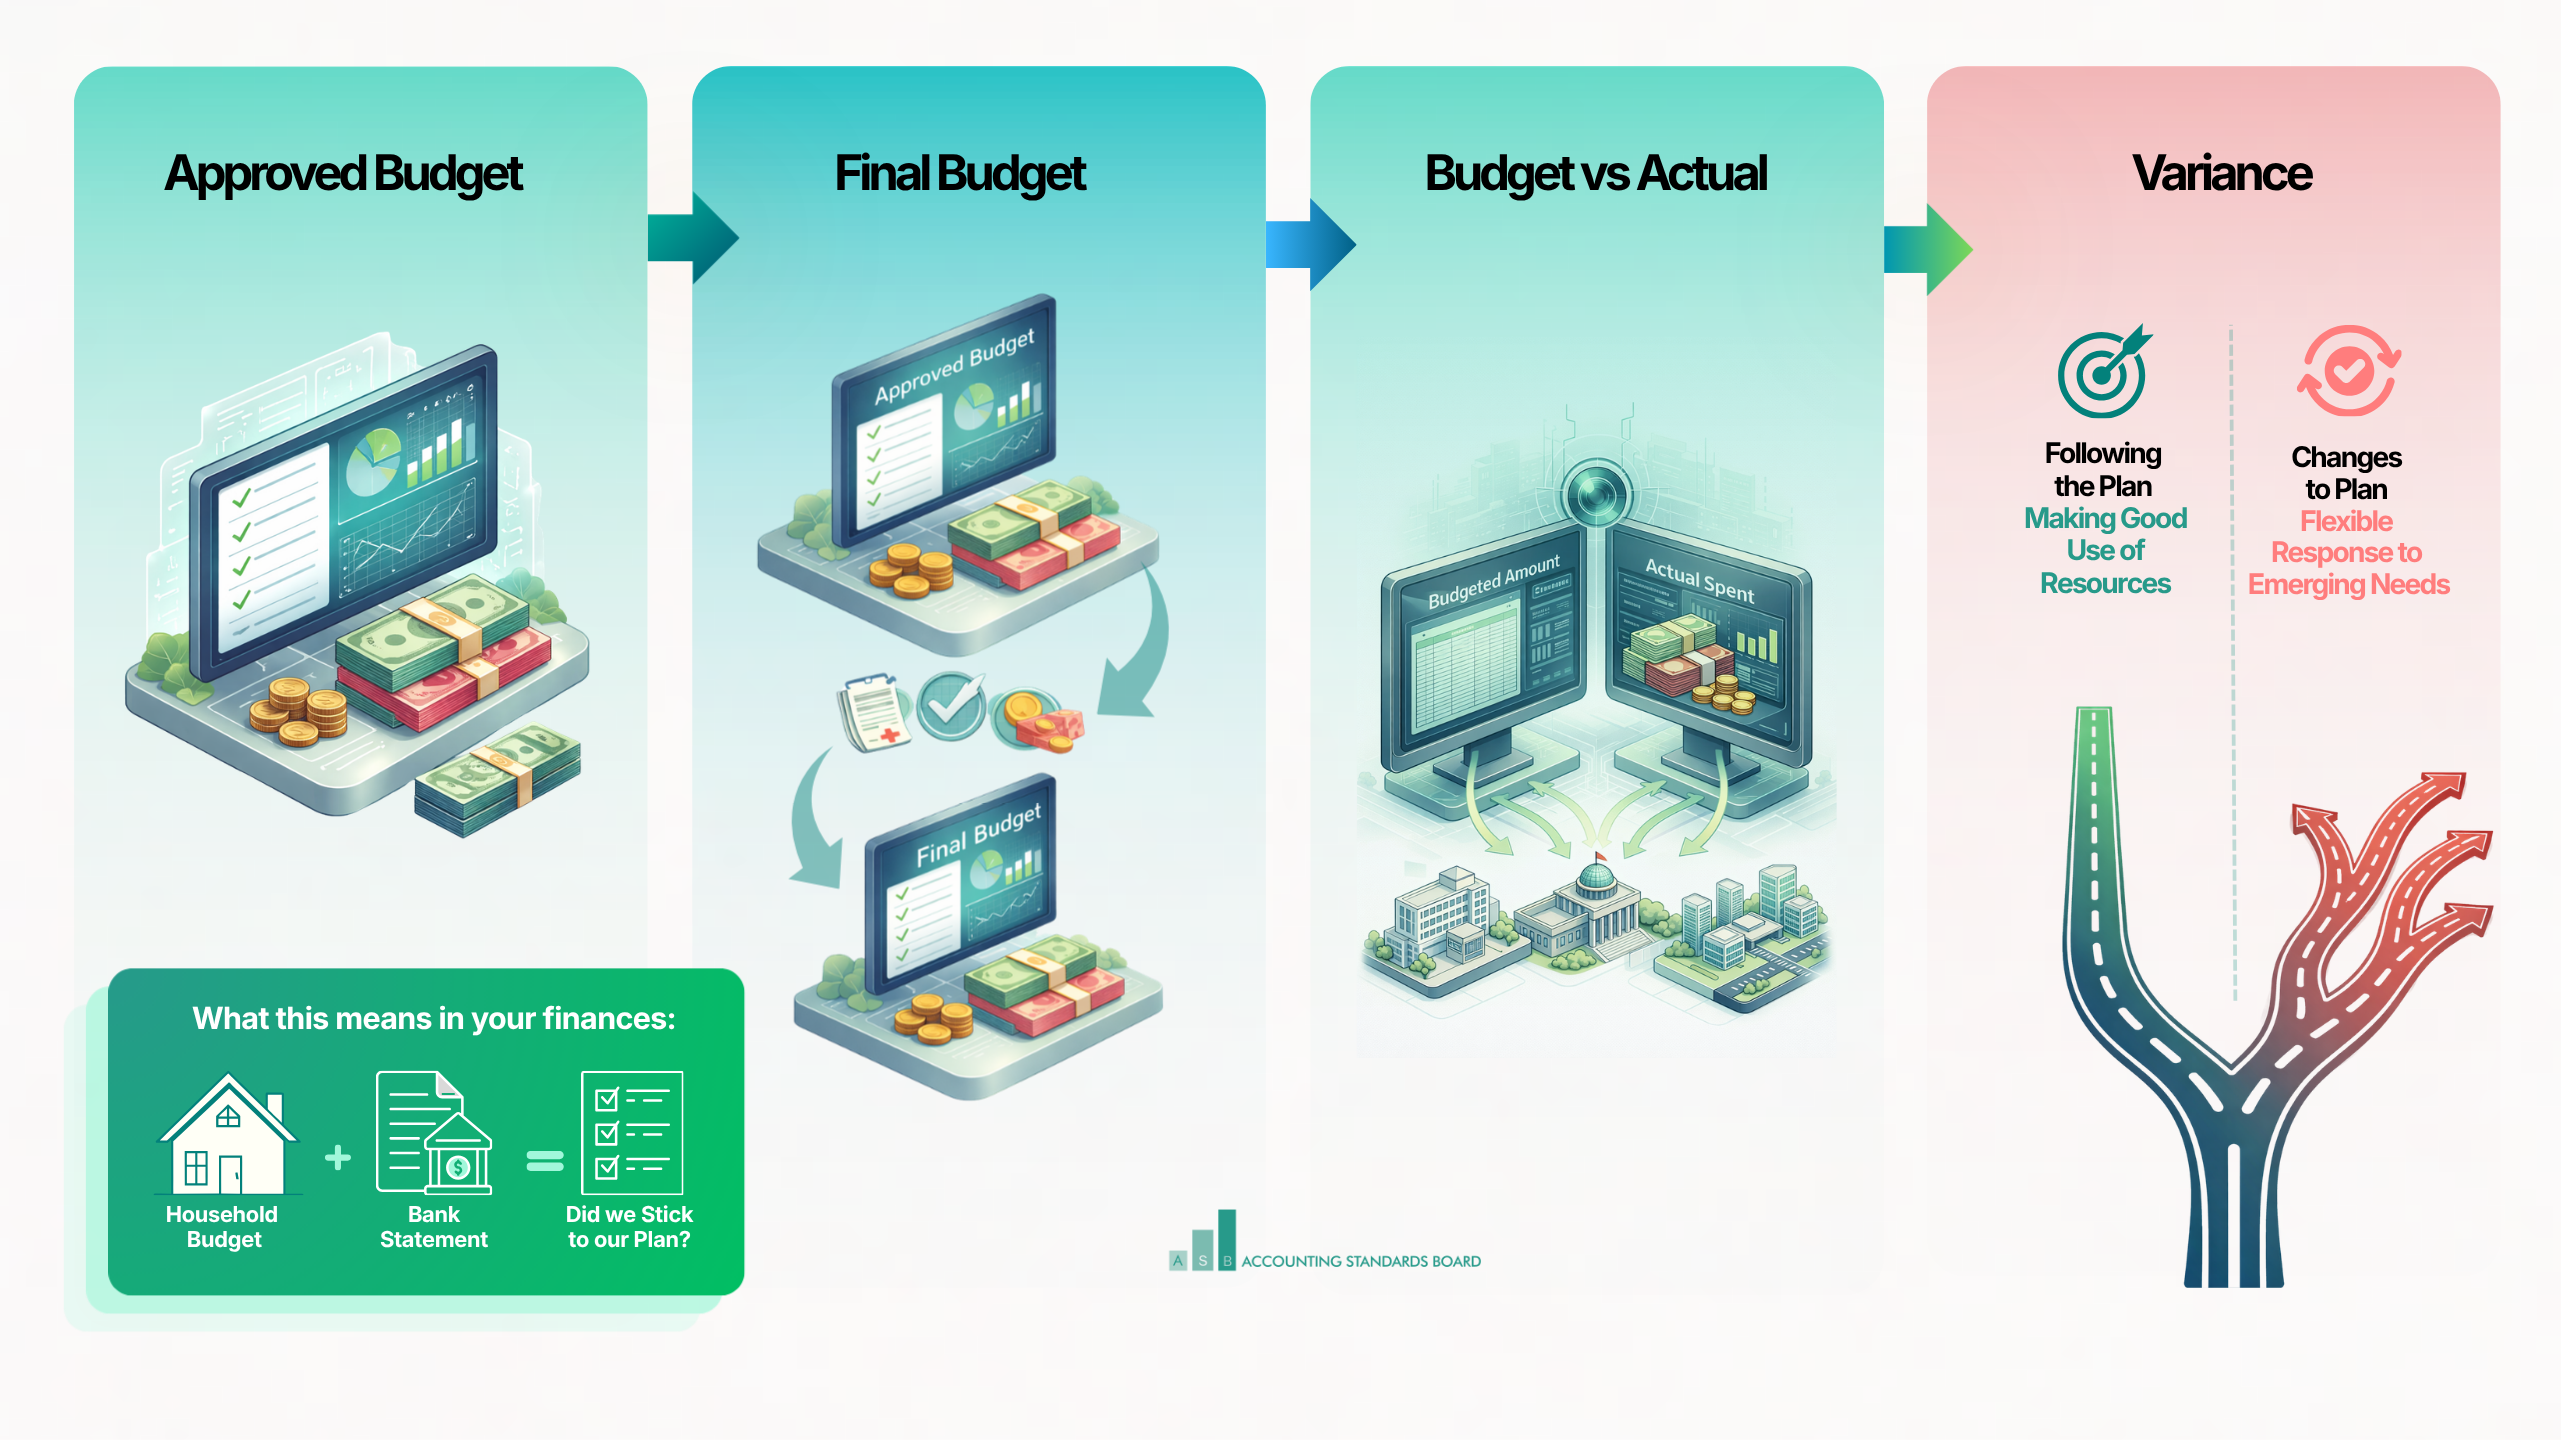
- Approved Budget – The budget most recently approved by management of the entity
- Final Budget – The budget after changes (for example, approved transfers between departments, roll-overs, or shifts).
- Budget vs Actual Amounts on a Comparable Basis – This means what the government actually collected and spent using the accrual basis of accounting. The actual amounts may be adjusted so they can be the same basis or classification used in the budget. The classification looks at how the budget line items are described and added together.
- Variance – This is the difference between the budget and actual results. Big differences are explained in the Notes to the Financial Statements.
- Approved Budget – The budget most recently approved by management of the entity
- Final Budget – The budget after changes (for example, approved transfers between departments, roll-overs, or shifts).
- Budget vs Actual Amounts on a Comparable Basis – This means what the government actually collected and spent using the accrual basis of accounting. The actual amounts may be adjusted so they can be the same basis or classification used in the budget. The classification looks at how the budget line items are described and added together.
- Variance – This is the difference between the budget and actual results. Big differences are explained in the Notes to the Financial Statements.
How is it structured?
illustrative Example
Government Entity Annual Financial Statements
Statement of Comparison of Budget and Actual Amounts for the period ended 31 March 2026
Government Entity Annual Financial Statements
Statement of Comparison of Budget and Actual Amounts
for the period ended 31 March 2026
Illustrative Figures Only
Description (Figures in Rand thousand)
Approved budget
adjustments
final budget
Actual
difference
note
What does it mean?
- Underspending - The government spent less than planned. This means fewer services were delivered. This shows a possible failure to deliver on promised services. For example, fewer houses were built. Check the APR to see if goals were missed.
- Overspending - The government spent more than planned. This may happen because of poor management or unexpected emergencies. Check the Notes to the Financial Statements to see why.
- Adjustments - Frequent changes to the budget (from approved to final budget) may show poor planning or change in priorities. This can make people lose trust in both service delivery and the budget process.
🔗 Connecting the dots to other government reports
This statement links the plans the government made to the actual results in the financial statements.
The Plan: It starts with the Strategic Plan or IDP which sets long-term goals. These goals become the APP or SDBIP for this year. The budget provides money to support these yearly goals.
It shows what the government owns and what it owes to others.
The Plan: There is usually no “Budgeted Balance Sheet,” but you can find the government’s plans in these documents:
- The Capital Programme – Shows the plans to buy, build, or fix assets (like land, buildings, roads or machinery).
- The Borrowing Plan – Shows how much new debt they plan to take on.
- The Cash Policy – Shows how much “emergency savings” they plan to keep in the bank.
The Link: Capital Programme: When you compare the plan to the actual amounts (on a comparable basis). You should compare the capital expenditure in the budget to the amounts in the Notes to the Financial Statements that show additions to PPE, Investment Property, Heritage Assets (adjusted to be comparable).
Look for these two main situations:
- If they spend less than planned (underspending) – This often means projects (like a new bridge or school) were delayed. It may look like the government “saved money,” but the community is actually losing out on a service that was promised.
- If they spend more than planned (overspending) – If the government overspends on its daily costs or loan payments, it has to get that money from somewhere. This usually means:
- Draining the bank – They use up their cash “savings.”
- Borrowing from tomorrow – They take out more loans, which means future budgets will have to pay for today’s overspending leaving less money for new services.
Borrowing Plan: Compare what is in the budget to the Non-current liabilities shown in the Statement of Financial Position. The Notes to the Financial Statements will show what debts were taken during the year.
The Plan: The budget sets targets for all expected revenue sources like taxes, grants, and fees. It also sets targets for all the spending for the year.
The Link: The actual amounts come from the Statement of Financial Performance. They are adjusted to match how the budget was first prepared. This includes:
The accounting method used (like cash instead of accrual);
How items were grouped (by programme or department);
The entities included in the budget; and
The layout of the budget table.
Due to these differences, the amounts in this statement may not look exactly the same as those shown in the Statement of Financial Performance.
This comparison shows where the government’s actual financial performance was different from the plan.

Citizen Tip: Ask the Right Questions
This statement is about more than numbers. It helps you see if government kept its promises.
👉 In simple terms, it answers these important questions:
Did government spend money as planned? If actual spending is close to the budget, it shows good planning. Big differences may mean plans changed or were not realistic.
Were services delivered as promised? If money was not spent, it may mean fewer services were delivered. If more was spent, it may point to poor planning or unexpected problems.
Are the reasons for differences clear? The Notes to the Financial Statements, Annual Report, and APR should explain why actual results differ from the budget. If reasons are unclear or happen every year, this may show weak accountability.
Can government be trusted to deliver? Repeated underspending or constant changes to the budget may reduce confidence in government’s ability to deliver on its plans.