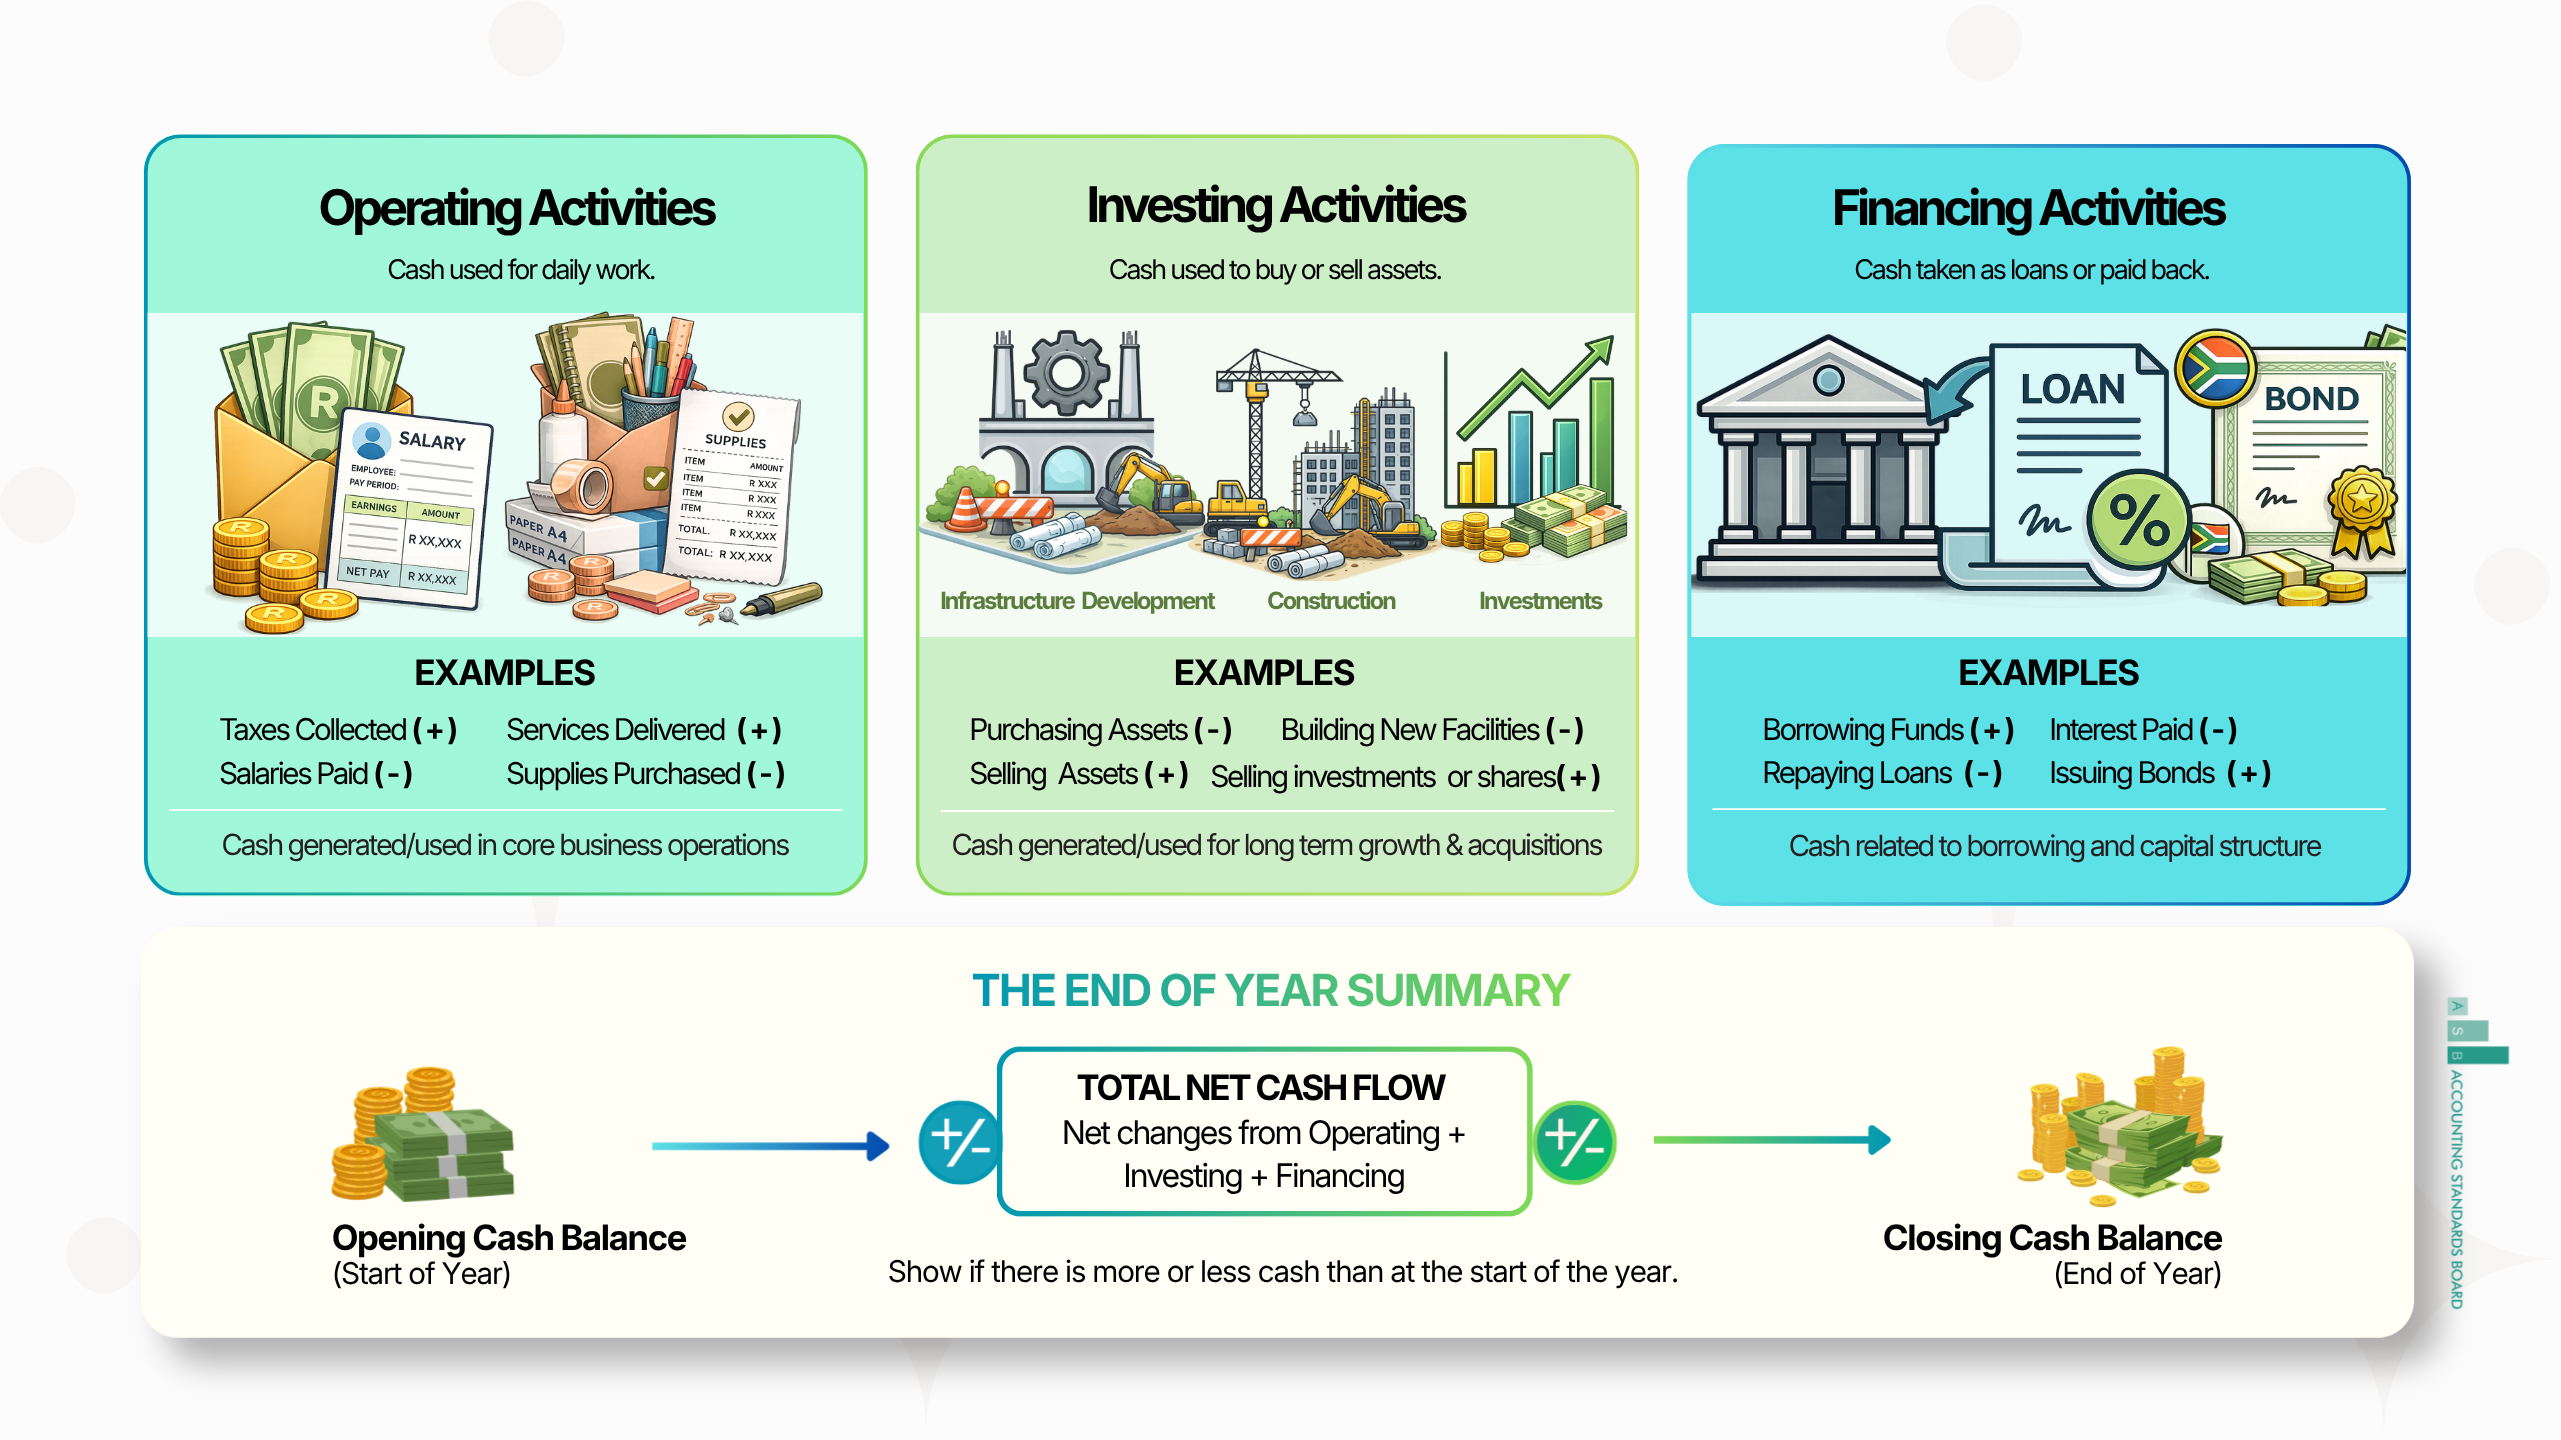
The Cash Flow Statement is different from other reports. It only shows cash. It does not show cash still owed to the government, or unpaid bills. It shows the real cash that came in and out of government’s wallet during the year. It tells you exactly where the cash came from and where it went.
The Cash Flow Statement has three main parts:
This part of the Cash Flow Statement shows the cash that comes from the government’s daily services.
This section is important as it shows if the government makes enough cash for daily expenses.
The report format used is called the “direct method”. It shows all cash receipts and cash payments. You will see a line showing “Net cash flows from or used in operating activities.” This is the cash left over (or short) after collecting taxes, service charges, and grants as well as after paying staff, suppliers, and grants. Extra details in the Notes to the Financial Statements explain any surplus or deficit.
This number shows if the government’s daily activities bring in enough cash to pay for services.
The government chooses where to show interest received and interest paid in the Cash Flow Statement. Interest received may be shown under operating or investing activities. Interest paid may be shown under operating or financing activities. This must be explained in the government’s rule book (accounting policies). It should stay the same from year to year.
When comparing different years or different government entities, do not assume they used the same method. First read the government’s rule book!
The Plan: The government needs cash coming in from daily work. This helps it pay salaries and deliver services. It supports the goals in the APP or SDBIP.
The Link: You can check the net cash flow figure in this section of the Cash Flow Statement. It shows if the government has enough cash to meet its service delivery promises in the APP/SDBIP.
The Plan: The cash flow budget shows how much cash should come in and go out during the year. It helps prevent running out of cash.
The Link: Compare the actual cash flows with the cash flow budget. This shows if the government is managing its daily cash well.

This number shows whether government has enough cash to run its day-to-day operations.
Ask yourself:
This section of the Cash Flow Statement shows the cash the government uses to buy or sell its assets that will be used for many years.
You will see “Net cash flows from investing activities.” This covers cash spent on or received from buying or selling assets like land and buildings, investments, office equipment, clinics, vehicles, roads, etc.
This number shows if the government is using cash to buy or improve assets for future service delivery.
The Plan: Cash outflows in this section should directly match with the yearly goals set in the APP/SDBIP.
The Link: Cash outflows in this section should directly match with the yearly goals set in the APP/SDBIP.
The Plan: The capital budget shows how much cash was planned for these purchases.
The Link: The Cash Flow Statement shows if cash was available and used for those plans. You can compare the actual cash spending here with the budgeted capital expenditure in the Statement of Comparison of Budget and Actual Amounts.

This section shows how government is investing in the future of your community.
Ask yourself:
This section of the Cash Flow Statement shows money coming in and going to lenders and funders. It shows if the government is taking out new loans, finance leases, or paying back old ones.
This section shows how the government manages its loans and other borrowings. Cash moves here when the government:
This tracks the cash used by government to pay for things it is “buying on credit” rather than paying for them in full today.
Note: Any interest on loans is an expense shown in operating or financing activities. This depends on the government’s rule book.
You will see a line called “Net cash flows from financing activities.” This shows loans and other borrowings taken (cash inflows) or loans paid back (cash outflows).
This number shows the government’s patterns for taking out loans.
A healthy sign:
A warning sign:
The Plan: New loans and other borrowings should match capital projects in the APP/SDBIP. These are meant to pay for large investments.
The Link: You can check the inflows here to see how much was for loans and other borrowings. Confirm in the Notes to the Financial Statements and Statement of Financial Position if that loan or other borrowing was used to pay for the specific assets promised in the APP/SDBIP.
The Plan: The capital budget and operating budget show planned loans taken and loans paid back.
The Link: The Cash Flow Statement shows if these plans were followed. The actual loans taken and loans paid back numbers should match those in the planning documents.

This section shows whether government is investing in the future or just trying to keep going.
Ask yourself:
This is the last line at the bottom of the Cash Flow Statement. It shows if the government has more or less cash than it had at the start of the year.
It comes from adding all the cash flows from Operating, Investing and Financing Activities. This gives the “net movement in cash.” When this is added to the opening balance, it shows the closing cash balance.
At the bottom of the Cash Flow Statement, you will see:
The three sections explain how cash moved. The final line shows if the government ended with more or less cash than at the start of the year. A positive movement means more cash available. A negative movement means using up saved up reserves.
The Plan: The cash balance shows if the government can keep its promises, repay debts, and cover costs for the year.
The Link: This closing cash balance shows how much is available to pay for the next year’s APP/SDBIP activities. If it is low, future plans might be delayed.
The Plan: The budget shows how much cash government planned to receive and how much they planned to spend during the year.
The Link: The closing cash balance helps to understand if actual cash position at year-end matches what was originally planned. It should be close to the Cash and Cash Equivalents amount shown in the Statement of Financial Position. This closing balance becomes the opening balance in next year’s financial statements and Cash Flow Budget.
A higher or lower balance than planned does not always mean good or bad performance. It must be read together with:
The Budget vs Actual report.
The Statement of Financial Performance.
The Statement of Financial Position (look, for example, for assets acquired or debts that are reduced).
The service delivery results.
When these reports are read together you can understand if government had enough cash and if they used it to deliver what was promised.

This number shows whether government has enough cash to run its day-to-day operations.
Ask yourself:
This section of the Cash Flow Statement shows money coming in and going to lenders and funders. It shows if the government is taking out new loans, finance leases, or paying back old ones.
This section shows how the government manages its loans and other borrowings. Cash moves here when the government:
This tracks the cash used by government to pay for things it is “buying on credit” rather than paying for them in full today.
Note: Any interest on loans is an expense shown in operating or financing activities. This depends on the government’s rule book.
You will see a line called “Net cash flows from financing activities.” This shows loans and other borrowings taken (cash inflows) or loans paid back (cash outflows).
This number shows the government’s patterns for taking out loans.
A healthy sign:
A warning sign:
The Plan: New loans and other borrowings should match capital projects in the APP/SDBIP. These are meant to pay for large investments.
The Link: You can check the inflows here to see how much was for loans and other borrowings. Confirm in the Notes to the Financial Statements and Statement of Financial Position if that loan or other borrowing was used to pay for the specific assets promised in the APP/SDBIP.
The Plan: The capital budget and operating budget show planned loans taken and loans paid back.
The Link: The Cash Flow Statement shows if these plans were followed. The actual loans taken and loans paid back numbers should match those in the planning documents.

This section shows whether government is investing in the future or just trying to keep going.
Ask yourself:
This section of the Cash Flow Statement shows the cash the government uses to buy or sell its assets that will be used for many years.
You will see “Net cash flows from investing activities.” This covers cash spent on or received from buying or selling assets like land and buildings, investments, office equipment, clinics, vehicles, roads, etc.
This number shows if the government is using cash to buy or improve assets for future service delivery.
The Plan: Cash outflows in this section should directly match with the yearly goals set in the APP/SDBIP.
The Link: Cash outflows in this section should directly match with the yearly goals set in the APP/SDBIP.
The Plan: The capital budget shows how much cash was planned for these purchases.
The Link: The Cash Flow Statement shows if cash was available and used for those plans. You can compare the actual cash spending here with the budgeted capital expenditure in the Statement of Comparison of Budget and Actual Amounts.

This section shows how government is investing in the future of your community.
Ask yourself:
This part of the Cash Flow Statement shows the cash that comes from the government’s daily services.
This section is important as it shows if the government makes enough cash for daily expenses.
The report format used is called the “direct method”. It shows all cash receipts and cash payments. You will see a line showing “Net cash flows from or used in operating activities.” This is the cash left over (or short) after collecting taxes, service charges, and grants as well as after paying staff, suppliers, and grants. Extra details in the Notes to the Financial Statements explain any surplus or deficit.
This number shows if the government’s daily activities bring in enough cash to pay for services.
The government chooses where to show interest received and interest paid in the Cash Flow Statement. Interest received may be shown under operating or investing activities. Interest paid may be shown under operating or financing activities. This must be explained in the government’s rule book (accounting policies). It should stay the same from year to year.
When comparing different years or different government entities, do not assume they used the same method. First read the government’s rule book!
The Plan: The government needs cash coming in from daily work. This helps it pay salaries and deliver services. It supports the goals in the APP or SDBIP.
The Link: You can check the net cash flow figure in this section of the Cash Flow Statement. It shows if the government has enough cash to meet its service delivery promises in the APP/SDBIP.
The Plan: The cash flow budget shows how much cash should come in and go out during the year. It helps prevent running out of cash.
The Link: Compare the actual cash flows with the cash flow budget. This shows if the government is managing its daily cash well.

This number shows whether government has enough cash to run its day-to-day operations.
Ask yourself: